Everything You Need to Track Your Health
LabsLedger gives you a complete lab result management system, right on your Mac.
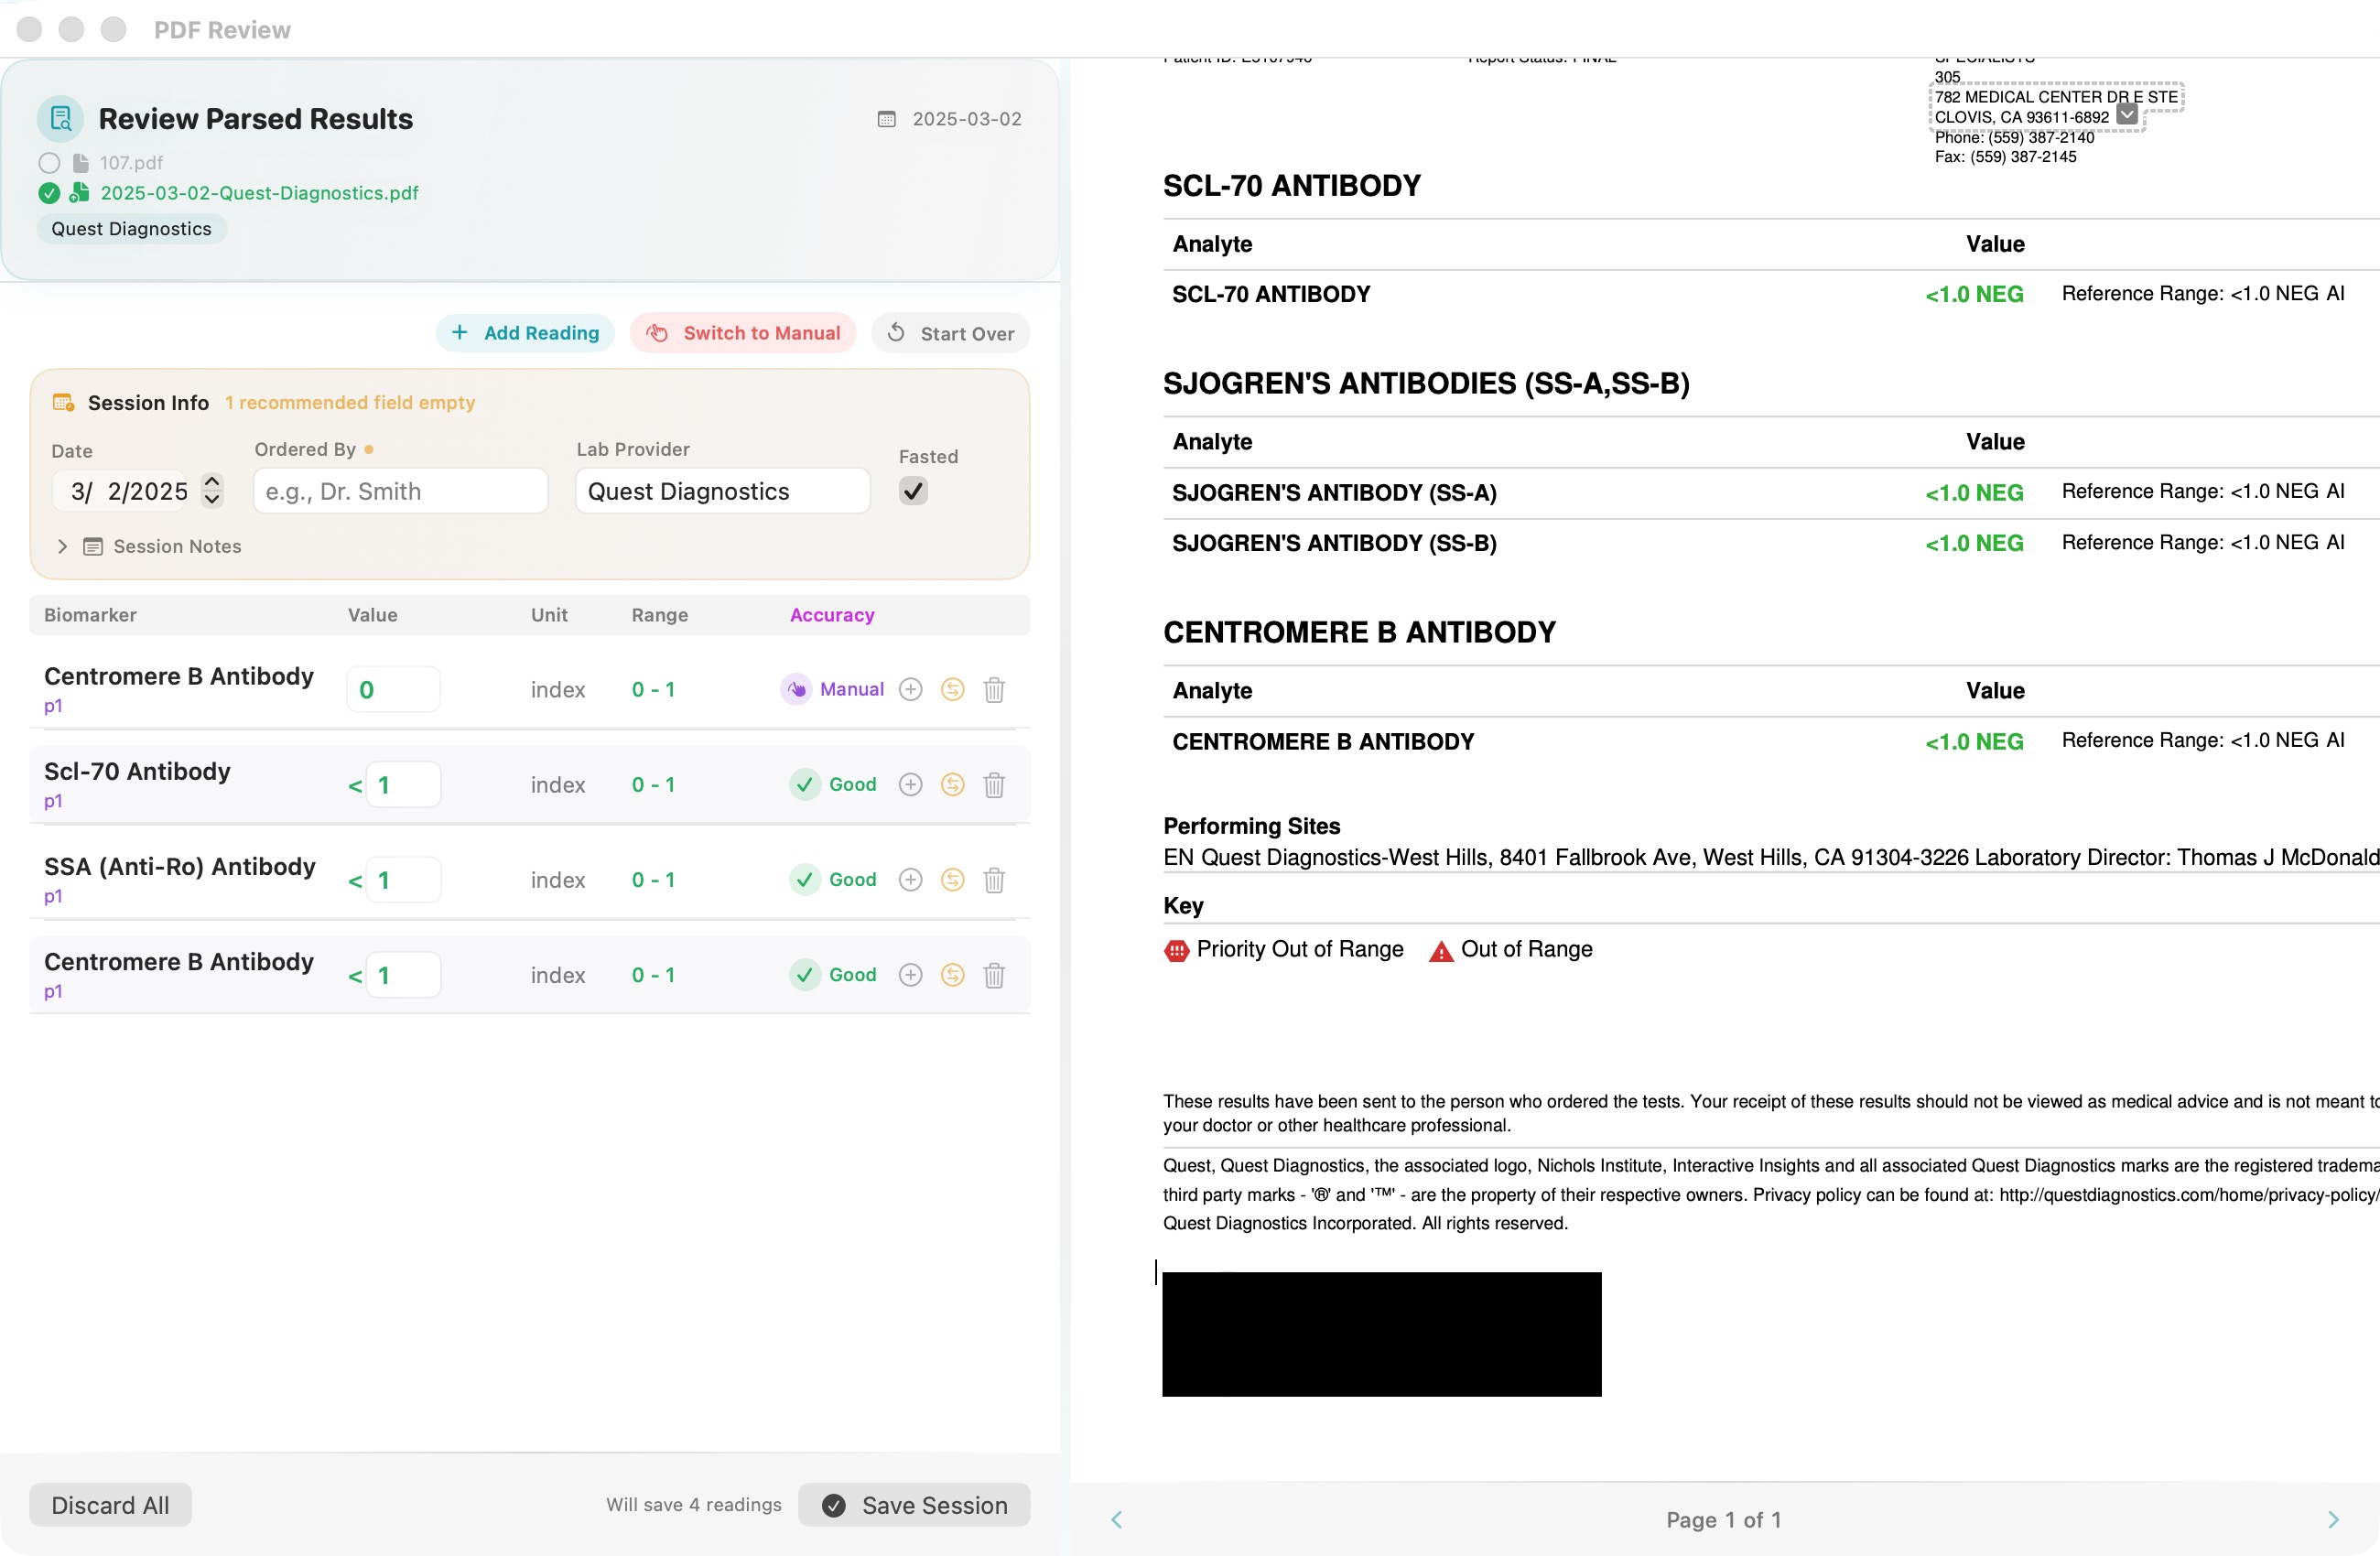
Intelligent PDF Parsing
LabsLedger uses Apple's on-device Vision OCR — not cloud-based AI — so your lab PDFs never leave your Mac. This is a deliberate choice: your health data stays private because parsing happens entirely on your hardware. OCR is optimized for Quest Diagnostics and LabCorp, but results vary by lab format and PDF quality. You'll always review before saving.*
- On-device OCR — your PDFs are never uploaded anywhere
- Optimized parsing for Quest Diagnostics, LabCorp, and Health Gorilla
- Results vary by format — always review before saving
- Split-pane review: parsed results alongside the original PDF
- Confidence scoring for each extracted biomarker value
- Manual entry available for any lab format
*OCR may not capture all biomarkers and accuracy varies by lab format and PDF quality. Always review parsed results and add any missing values manually. Manual entry is available for any lab format.
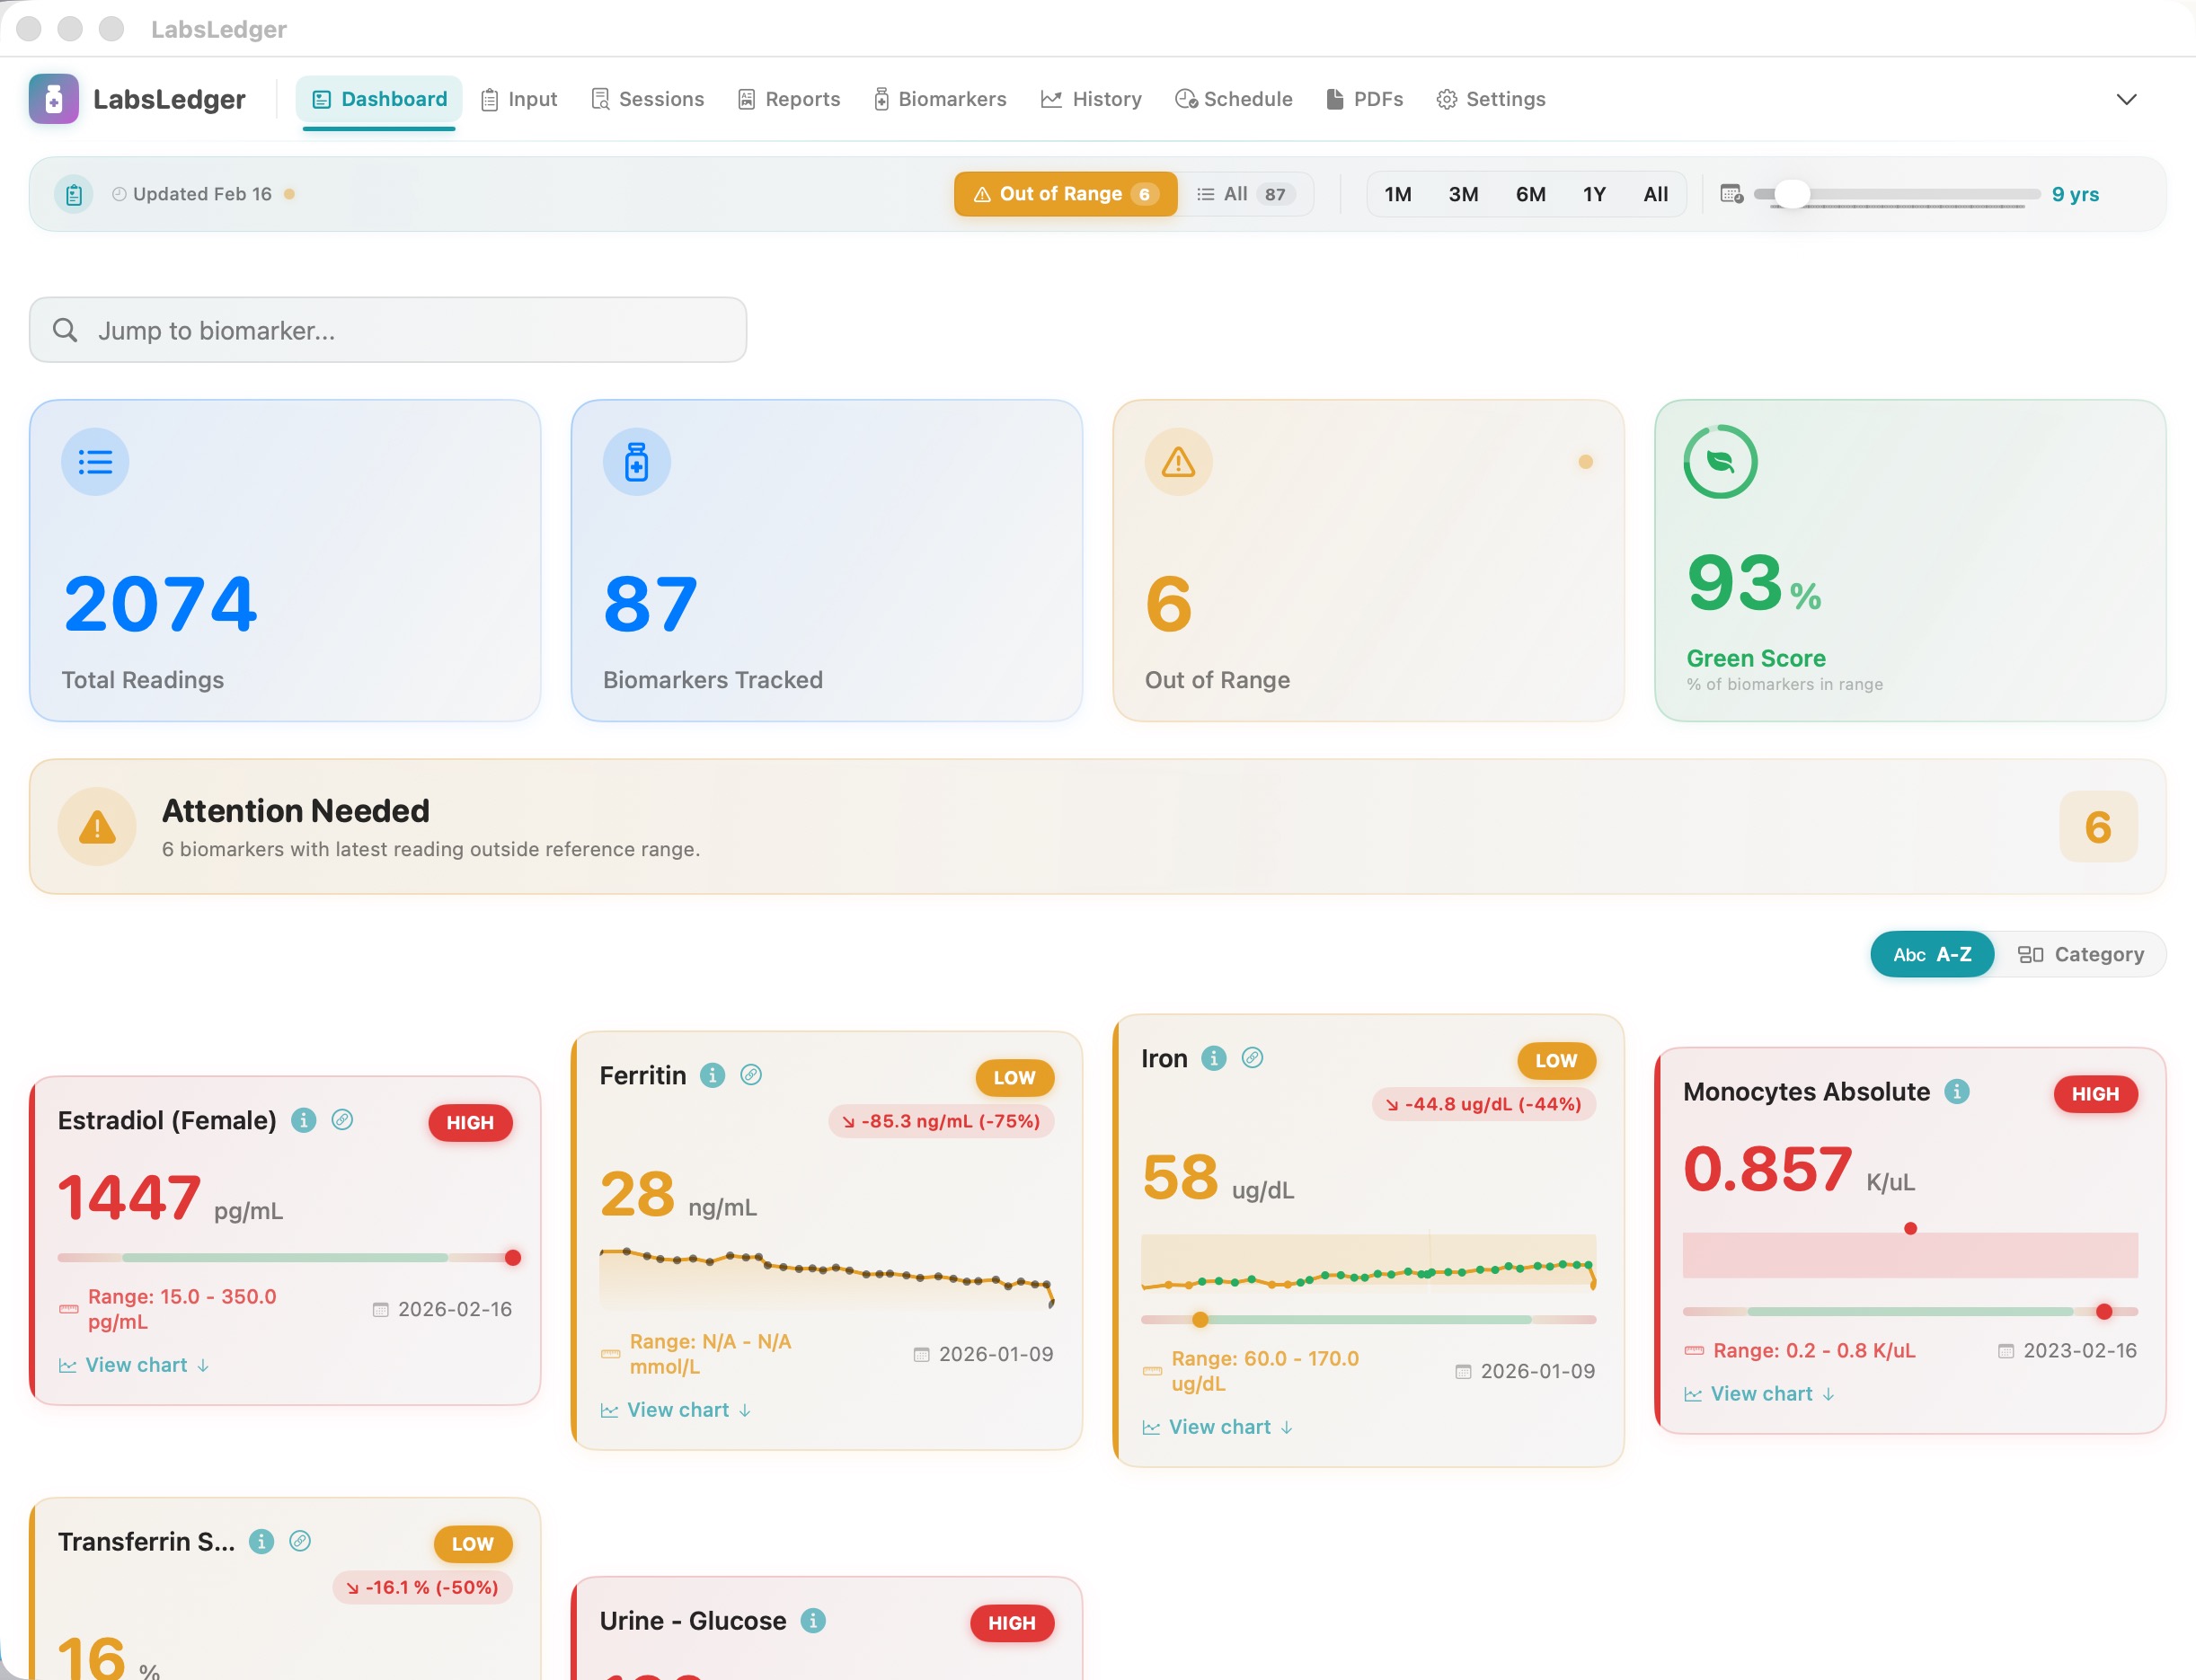
Your Health at a Glance
The Dashboard gives you an instant overview of your health status. The Green Score shows what percentage of your biomarkers are in range, while individual cards display values, sparklines, and trend deltas — all color-coded by clinical status.
- Green Score: instant health snapshot as a percentage
- Summary cards: Total Readings, Biomarkers Tracked, Out of Range
- Biomarker cards with sparklines and status badges (HIGH/LOW)
- 11 clinical categories: CBC, Lipids, Liver, Kidney, Thyroid, and more
- Filter by out-of-range or view all biomarkers
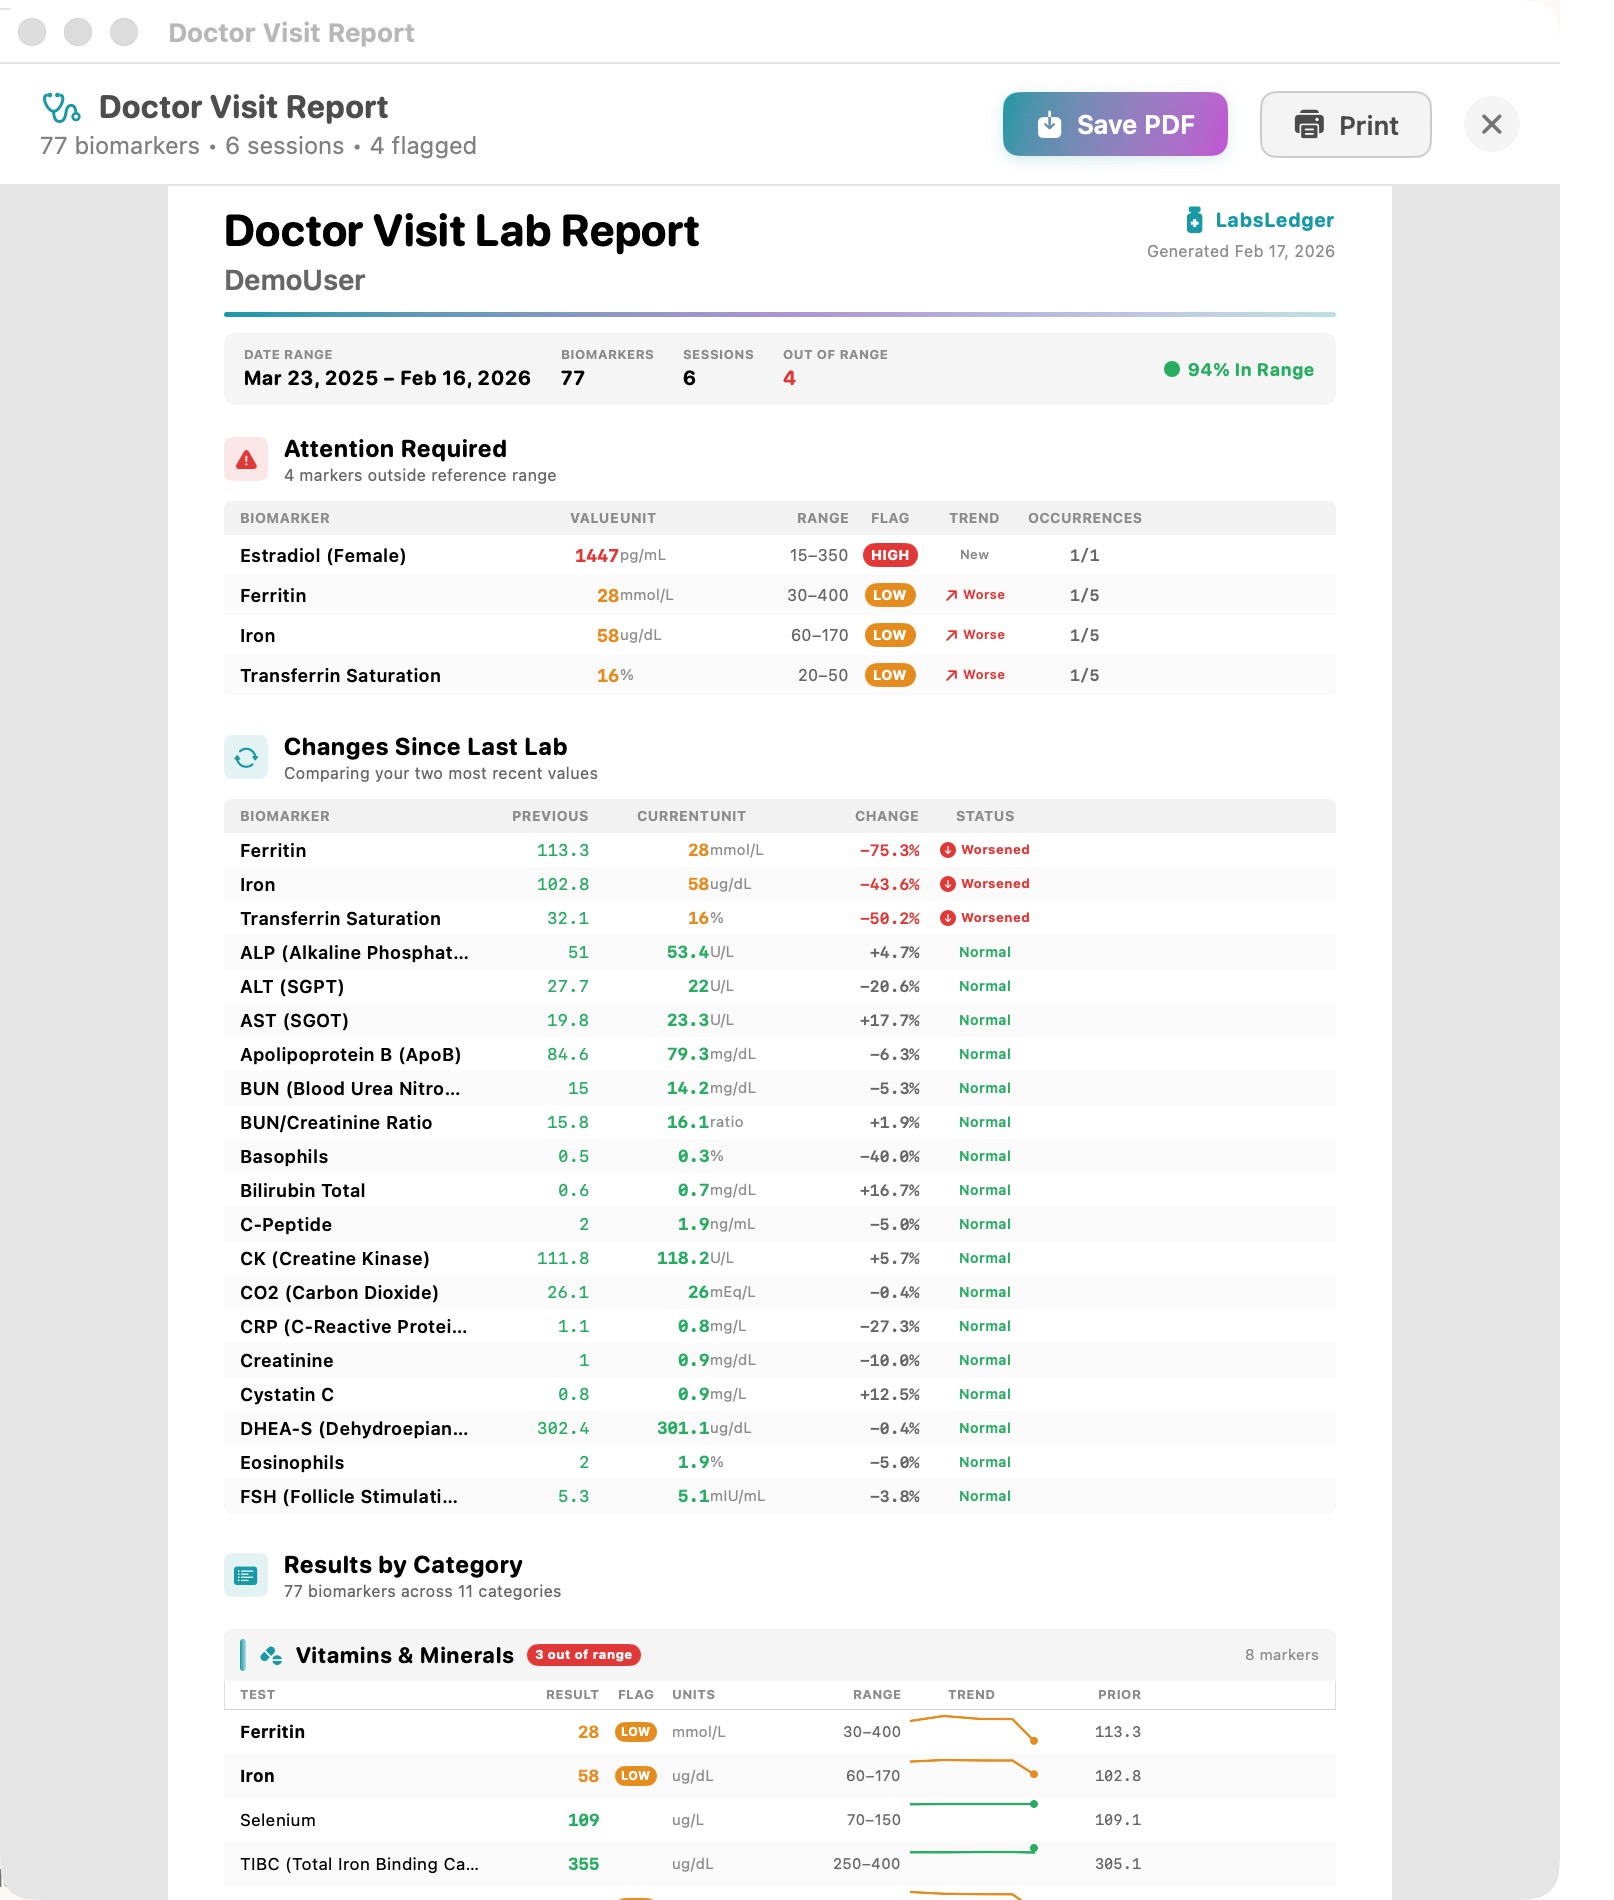
Professional Reports for Your Doctor
Generate comprehensive Doctor Visit Reports and Doctor Reports that summarize your lab history. Each report includes attention items, trend comparisons, and category breakdowns — perfect for bringing to your next healthcare appointment.
- Doctor Visit Report: multi-page PDF with full lab summary
- Attention Required section highlights out-of-range biomarkers
- Changes Since Last Lab: delta comparisons with status indicators
- Results by Category: organized by clinical category with trend charts
- Print directly or save as PDF with one click
See How Your Health Changes Over Time
Track every biomarker over months and years with interactive line charts. Reference range bands show where you should be, while trend lines reveal whether you're improving or declining. Type-aware visualization handles quantitative, ordinal, nominal, titer, and narrative data.
- Interactive line charts with reference range bands
- Per-biomarker history with date-stamped readings
- Type-aware display for different biomarker types
- Configurable time ranges: 1M, 3M, 6M, 1Y, All
- Session-level notes preserved with each data point
Organize Every Lab Visit
Each lab draw becomes a session with rich metadata — date, provider, fasted status, and free-form notes. Compare any two sessions side by side to see exactly what changed and by how much.
- Session metadata: date, lab provider, fasted status, ordered by
- Side-by-side session comparison with percentage changes
- Session notes with PDF export capability
- Support for multiple lab providers per session
Privacy Is Not a Feature. It Is the Architecture.
LabsLedger was designed from the ground up with your privacy as the highest priority.
Zero Data Transmission
We never access, collect, or transmit your health data. Period.
Local Storage Only
All data lives on your Mac or your personal iCloud — your choice.
No Analytics
No usage tracking, no telemetry, no data collection of any kind.
Encrypted Backups
AES-256-GCM encryption for backups. Your data, your key.
900+ Biomarkers Across 11 Clinical Categories
Ready to get started?
One-time purchase. Free updates for life.
One-time purchase. Free updates for life.